1. pheriday 0: scientist-hacker howto (video post)

    Hey everyone, here's pheriday 0, the first of paul's habitual errant ramblings (on Fr)idays

    pheriday 0: scientist-hacker howto (2012-07-20) from Paul Ivanov on Vimeo.

    Berkeley Kite Festival (510 Families)

    Merlin Mann's Most Days (specifically the travel day one on 2009-01-11)

    Sad that I missed SciPy Conference this year. One of the things I like doing at scipy is nerding it up with my friends, seeing each others workflows, showing off vim tricks, etc. This video was my attempt at scratching that itch, a little bit. As I mention in the video, this is take 2. Take 1 ended when I ran out disk space, but needless to say, it was more awesome than this. It seems I am cursed with losing first takes, see also a summary of last year's SciPy conference, where this exact same thing happened.

    NumFOCUS: NumPy Foundation for Open Code for Usable Science

    NumFOCUS Google Group see thread titled: "[Funding] Notes from Funding BOF at SciPy2012"

    TLDP: The Linux Documentation Project (page I was scrolling through)

    Transition to Gopher was rough this time, it was better during the first take.

    Lorance Stinson's w3m (better) gopher support Use this if, for example, going to w3m gopher://sdf.org you get errors like:

    [unsupported] '/1' doesn't exist! [unsupported] This resource cannot be located.
    

    It still took some tweaking, shoot me an email for details

    Robert Bigelow's About | Gopher & GopherSpace

    Here's the HTTP Proxied version of the above: Gopher proxy provided by Floodgap

    SDF Public Access UNIX System http://sdf.org gopher://sdf.org/1

    Eric S. Raymond's How To Become a Hacker Howto

    Fernando Perez' Py4Science Starter Kit

    Q: Why are you using "Chromium --incognito"? I have chronic tabitis, and this is one way of mitigating that problem. If the browser crashes or I shutdown my computer, I won't have those tabs around anymore.

    programs used: Debian GNU/Linux sid, recordmydesktop, xmonad, fbpanel, screen, chromium, cheese, xcompmgr, mutt, wyrd, tail, w3m

    gopher version of this post (proxy)

    permalink
  2. Ada Lovelace Day: remembering Shirley Theis and Evelyn Silvia

    In case you didn't know it - today is Ada Lovelace Day!

    Now, as any self-respecting Computer Science degree-wielding person should, I, too, think it's important to celebrate the day named after the world's very first programmer.

    For me, the first math teacher I remember making a big difference was Shirley Theis - who taught me Algebra in 8th grade at McKinley Middle School in Redwood City, CA. Mrs Theis, an energetic dynamo in her mid fifties, was a deeply motivated and caring teacher, who expected a lot out of her students, but never in a disciplinary manner. She was full of enthusiasm, which projected out and infected even the most timid or disaffected student: in her class, you couldn't be just a sack of potatoes planted in your seat.

    She often lead class in a nearly theatrical manner - pacing back and forth, egging students on by eagerly repeating their partial responses, getting exponentially more excited if the student was on the right track, barely containing herself from jumping up and down in anticipation of that lightbulb going off -- and yet just as quickly waning in her enthusiasm,becoming a personified caricature of hopelessness and despair to let you know the instant a response was starting to go astray.

    It may have been the only math class I've ever taken where there were group assignments - we would work with a partner or a few classmates in trying to figure out an assignment, first trying it solo, and then putting our heads together to figure out why our answers disagree and which is the right one. I believe it was Mrs. Theis who succinctly captured a value I hold in high regard: "it's not about how far you go - it's about how many people you bring with you."

    There was one other mathematics teacher I had in my life who clearly stands out: it was Professor Evelyn Silvia who had a comparable level of enthusiasm and energy, and from whom I had the pleasure of taking the first upper-division math course (Math 108 - Intro to Abstract Math) during my second quarter at UC Davis. Dr. Silvia was the real deal - she cared, gesticulated, encouraged us to question why something was true, and had an approach which demanded we each take ownership of our education. The book for the course, Introduction to Abstract Mathematics: A Working Excursion by D.O. Cutler and E.M. Silvia was a blue workbook - each of us had our own copy, and there were blanks left out for us to write our own answers to the exercises. The fact that the book had blanks for me to fill in was so inviting, there was a kind of "working mathematician" approach that came with it with that it made me really enjoy and look forward to working through the material. I still have mine.

    Dr. Silvia was incredibly sharp, not just intellectually but also interpersonally. Not only could she gauge when the class was lost, but she also had a knack for spotting if something was affecting you outside of class. She was really committed to helping you not just as a student, but as a person. I remember spending hours at Mishka's, or Cafe Roma, or the CoHo, reading and writing, wanting to do well and not let Silvia down, because she invested so much energy and placed a great deal of trust in us.

    So thank you both, Shirley Theis and Evelyn Silvia - you both encouraged me to grow a lot as a person, challenged my concept of what it means to be a student, and by your example provided a template of what it means to be an effective teacher, which I've imitated and embraced with pleasure in my own teaching.

    (tagged scipy to spread word of Ada Lovelace day to Planet SciPy)

    permalink
  3. vim-ipython two-way integration! (updated: 2011-08-02)

    I'm very pleased to share with you a demo the forthcoming vim-ipython integration which will work with IPython 0.11(trunk).

    You can either use the Flash player below, or download the OggVorbis file (14MB) update: vim-ipython 'shell' demo (9.6MB). The blog-free form of this post is here.

    If you like what you see and want to try it, you can get the details from the vim-ipython github page and it currently requires 4 line changes to IPython, which are currently in this pull request. (Fixed to work on IPython trunk with no changes).

    Big thanks to Min for walking me through the new IPython kernel manager during the SciPy2011 sprints.

    UPDATE: 2011-08-02

    vim-ipython ‘shell’ mode.

    Just in case, here are the same videos as above, but hosted on Youtube:

    If you're have any issues, try searching for your error on the vim-ipython github issues page, and if you don't find it, please file a new one, and I'll help you out there.

    permalink
  4. Money and CA Propositions

    Since tomorrow we'll be having another one of those practice democracy drills here in California, I thought I'd put together a few bar charts.

    There are five propositions on tomorrow's ballot. In researching them, Lena came across the Cal-Access Campaign Finance Activity: Propositions & Ballot Measures.

    Unfortunately, for each proposition, you have to click through each committee to get the details for the amount of money they've raised and spent. Here's a run-down in visual form, the only data manipulation I did was round to the nearest dollar. Note: no committees formed to support or oppose Proposition 13.

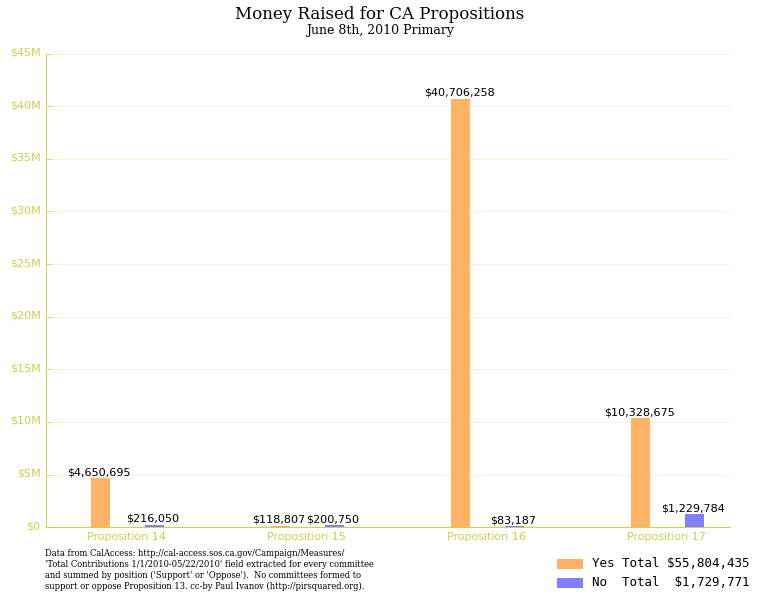
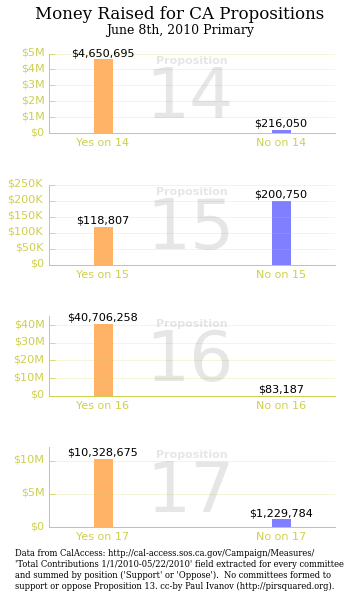
    Here's how much money was raised, by proposition:

    Money
Raised

    Just in case you didn't get the full picture, here is the same data plotted on a common scale:

    Money Raised (common
scale)

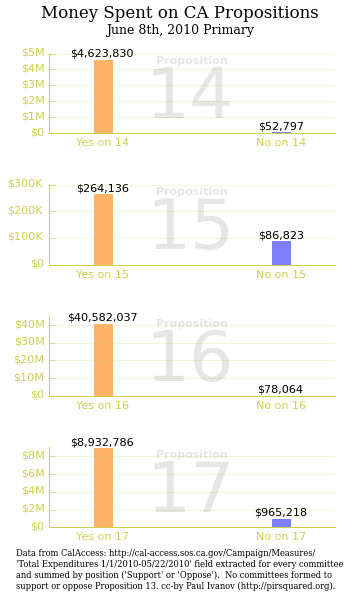
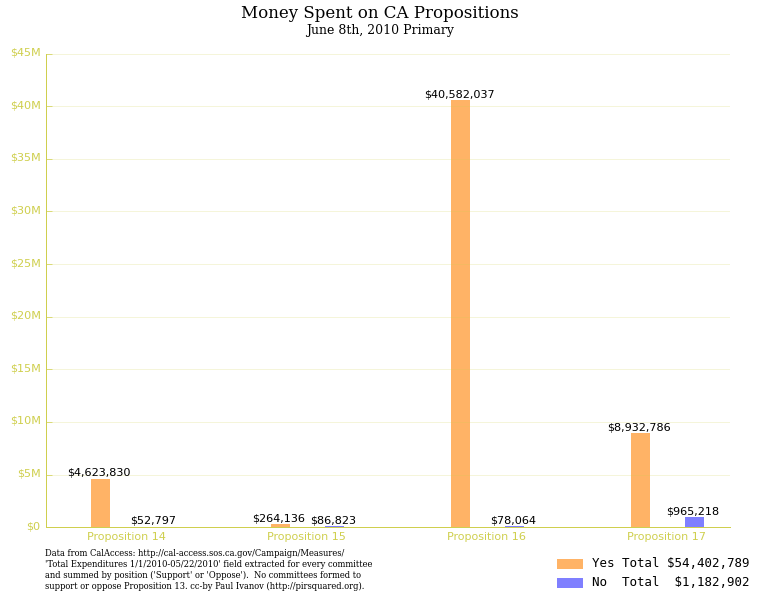
    And the same two plots for money spent ((I don't fully understand what these numbers mean, as some groups' "Total Expenditures" exceed their "Total Contributions" and still had positive "Ending Cash")):

    Money Spent

    Money Spent (common scale)

    It could just be my perception of things, but I get pretty suspicious when there's a ton of money involved in politics, especially when it's this lopsided.

    The only thing I have to add is you should Vote "YES" on Prop 15, because Larry Lessig says so, and so do the Alameda County Greens!

    Update #1: Let me write it out in text, so that the search engines have an easier time finding this. According to the official record from Cal-Access (Secretary of State), as of May 22nd, 2010, there were $54.4 million spent in support of various propositions, most notably $40.5 million on Prop 16, $8.9 million on Prop 17, and $4.6 million on Prop 14. Compare that with a "grand" total of less than $1.2 million spent to oppose them, with a trivial $78 thousand (!!) to oppose Prop 16's $40.5 million deep pockets.

    Update #2: The California Voter Foundation included more recent totals (they don't seem to be that different), as well as a listing of the top 5 donors for each side of a proposition in their Online Voter Guide.

    Also, here's the python code used to generate these plots (enable javascript to get syntax highlighting):

    # Create contributions and expenditures bar charts of committees supporting and
    # opposing various propositions on the California Ballot for June 8th, 2010
    # created by Paul Ivanov (http://pirsquared.org)
    
    # figure(0) - Contributions by Proposition (as subplots)
    # figure(1) - Expenditures by Proposition (as subplots)
    # figure(2) - Contributions on a common scale
    # figure(3) - Expenditures on a common scale
    
    import numpy as np
    from matplotlib import pyplot as plt
    import locale
    
    # This part was done by hand by collecting data from CalAccess:
    # http://cal-access.sos.ca.gov/Campaign/Measures/
    prop = np.array([
         4650694.66, 4623830.07    # Yes on 14 Contributions, Expenditures
        , 216050, 52796.71         # No  on 14 Contributions, Expenditures
        , 118807.45, 264136.30     # Yes on 15 Contributions, Expenditures
        , 200750.01, 86822.79      # No  on 15 Contributions, Expenditures
        , 40706258.17, 40582036.58 # Yes on 16 Contributions, Expenditures
        , 83187.29, 78063.91       # No  on 16 Contributions, Expenditures
        , 10328675.12, 8932786.06  # Yes on 17 Contributions, Expenditures
        , 1229783.79, 965218.48    # No  on 17 Contributions, Expenditures
        ])
    prop.shape = -1,2,2
    
    def currency(x, pos):
        """The two args are the value and tick position"""
        if x==0:
            return "$0"
        if x < 1e3:
            return '$%f' % (x)
        elif x< 1e6:
            return '$%1.0fK' % (x*1e-3)
        return '$%1.0fM' % (x*1e-6)
    
    from matplotlib.ticker import FuncFormatter
    formatter = FuncFormatter(currency)
    
    yes,no = range(2)
    c = [(1.,.5,0),'blue']  # color for yes/no stance
    a = [.6,.5]             # alpha for yes/no stance
    t = ['Yes','No ']       # text  for yes/no stance
    
    raised,spent = range(2)
    title = ["Raised for", "Spent on" ] # reuse code by injecting title specifics
    field = ['Contributions', 'Expenditures']
    
    footer ="""
    Data from CalAccess: http://cal-access.sos.ca.gov/Campaign/Measures/
    'Total %s 1/1/2010-05/22/2010' field extracted for every committee
    and summed by position ('Support' or 'Oppose').  No committees formed to
    support or oppose Proposition 13. cc-by Paul Ivanov (http://pirsquared.org).
    """ # will inject field[col] in all plots
    
    color = np.array((.9,.9,.34))*.9 # spine/ticklabel color
    plt.rcParams['savefig.dpi'] = 100
    
    def fixup_subplot(ax,color):
        """ Tufte-fy the axis labels - use different color than data"""
        spines = ax.spines.values()
        # liberate the data! hide right and top spines
        [s.set_visible(False) for s in spines[:2]]
        ax.yaxis.tick_left() # don't tick on the right
    
        # there's gotta be a better way to set all of these colors, but I don't
        # know that way, I only know the hard way
        [s.set_color(color) for s in spines]
        [s.set_color(color) for s in ax.yaxis.get_ticklines()]
        [s.set_visible(False) for s in ax.xaxis.get_ticklines()]
        [(s.set_color(color),s.set_size(8)) for s in ax.xaxis.get_ticklabels()]
        [(s.set_color(color),s.set_size(8)) for s in ax.yaxis.get_ticklabels()]
        ax.yaxis.grid(which='major',linestyle='-',color=color,alpha=.3)
    
    # for subplot spacing, I fiddle around using the f.subplot_tool(), then get
    # this dict by doing something like:
    #    f = plt.gcf()
    #    adjust_dict= f.subplotpars.__dict__.copy()
    #    del(adjust_dict['validate'])
    #    f.subplots_adjust(**adjust_dict)
    
    adjust_dict = {'bottom': 0.12129189716889031, 'hspace': 0.646815834767644,
     'left': 0.13732508948909858, 'right': 0.92971038073543777,
     'top': 0.91082616179001742, 'wspace': 0.084337349397590383}
    
    for col in [raised, spent]: #column to plot - money spent or money raised
        # subplots for each proposition (Fig 0 and Fig 1)
        f = plt.figure(col); f.clf(); f.dpi=100;
        for i in range(len(prop)):
            ax = plt.subplot(len(prop),1, i+1)
            ax.clear()
            p = i+14    #prop number
            for stance in [yes,no]:
                plt.bar(stance, prop[i,stance,col], color=c[stance], linewidth=0,
                        align='center', width=.1, alpha=a[stance])
                lbl = locale.currency(round(prop[i,stance,col]), symbol=True, grouping=True)
                lbl = lbl[:-3] # drop the cents, since we've rounded
                ax.text(stance, prop[i,stance,col], lbl , ha='center', size=8)
    
            ax.set_xlim(-.3,1.3)
            ax.xaxis.set_ticks([0,1])
            ax.xaxis.set_ticklabels(["Yes on %d"%p, "No on %d"%p])
    
            # put a big (but faded) "Proposition X" in the center of this subplot
            common=dict(alpha=.1, color='k', ha='center', va='center', transform = ax.transAxes)
            ax.text(0.5, .9,"Proposition", size=8, weight=600, **common)
            ax.text(0.5, .50,"%d"%p, size=50, weight=300, **common)
    
            ax.yaxis.set_major_formatter(formatter) # plugin our currency labeler
            ax.yaxis.get_major_locator()._nbins=5 # put fewer tickmarks/labels
    
            fixup_subplot(ax,color)
    
        adjust_dict.update(left=0.13732508948909858,right=0.92971038073543777)
        f.subplots_adjust( **adjust_dict)
    
        # Figure title, subtitle
        extra_args = dict(family='serif', ha='center', va='top', transform=f.transFigure)
        f.text(.5,.99,"Money %s CA Propositions"%title[col], size=12, **extra_args)
        f.text(.5,.96,"June 8th, 2010 Primary", size=9, **extra_args)
    
        #footer
        extra_args.update(va='bottom', size=6,ma='left')
        f.text(.5,0.0,footer%field[col], **extra_args)
    
        f.set_figheight(6.); f.set_figwidth(3.6); f.canvas.draw()
        f.savefig('CA-Props-June8th2010-%s-Subplots.png'%field[col])
    
        # all props on one figure (Fig 2 and Fig 3)
        f = plt.figure(col+2); f.clf()
        adjust_dict.update(left= 0.06,right=.96)
        f.subplots_adjust( **adjust_dict)
        f.set_figheight(6.)
        f.set_figwidth(7.6)
    
        extra_args = dict(family='serif', ha='center', va='top', transform=f.transFigure)
        f.text(.5,.99,"Money %s CA Propositions"%title[col], size=12, **extra_args)
        f.text(.5,.96,"June 8th, 2010 Primary", size=9, **extra_args)
    
        extra_args.update(ha='left', va='bottom', size=6,ma='left')
        f.text(adjust_dict['left'],0.0,footer%field[col], **extra_args)
    
        ax = plt.subplot(111)
        for stance in [yes,no]:
            abscissa=np.arange(0+stance*.30,4,1)
            lbl = locale.currency(round(prop[:,stance,col].sum()),True,True)
            lbl = lbl[:-3] # drop the cents, since we've rounded
            lbl = t[stance]+" Total"+ lbl.rjust(12)
            plt.bar(abscissa,prop[:,stance,col], width=.1, color=c[stance],
                    alpha=a[stance],align='center',linewidth=0, label=lbl)
            for i in range(len(prop)):
                lbl = locale.currency(round(prop[i,stance,col]), symbol=True, grouping=True)
                lbl = lbl[:-3] # drop the cents, since we've rounded
                ax.text(abscissa[i], prop[i,stance,col], lbl , ha='center',
                        size=8,rotation=00)
    
        ax.set_xlim(xmin=-.3)
        ax.xaxis.set_ticks(np.arange(.15,4,1))
        ax.xaxis.set_ticklabels(["Proposition %d"%(i+14) for i in range(4)])
        fixup_subplot(ax,color)
    
        # plt.legend(prop=dict(family='monospace',size=9)) # this makes legend tied
        # to the subplot, tie it to the figure, instead
        handles, labels = ax.get_legend_handles_labels()
        l = plt.figlegend(handles, labels,loc='lower right',prop=dict(family='monospace',size=9))
        l.get_frame().set_visible(False)
        ax.yaxis.set_major_formatter(formatter) # plugin our currency labeler
        f.canvas.draw()
        f.savefig('CA-Props-June8th2010-%s.png'%field[col])
    
    plt.show()
    
    permalink

« Page 3 / 3