Since tomorrow we'll be having another one of those practice democracy drills here in California, I thought I'd put together a few bar charts.
There are five propositions on tomorrow's ballot. In researching them, Lena came across the Cal-Access Campaign Finance Activity: Propositions & Ballot Measures.
Unfortunately, for each proposition, you have to click through each committee to get the details for the amount of money they've raised and spent. Here's a run-down in visual form, the only data manipulation I did was round to the nearest dollar. Note: no committees formed to support or oppose Proposition 13.
Here's how much money was raised, by proposition:

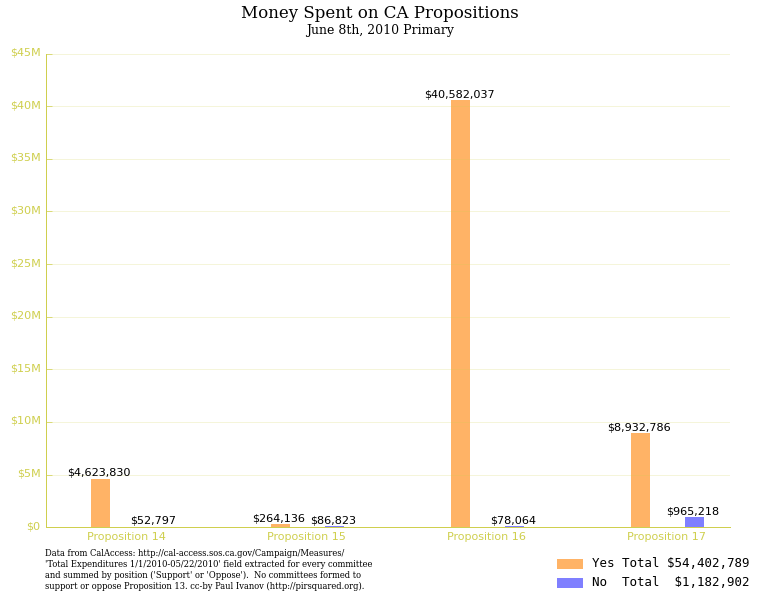
Just in case you didn't get the full picture, here is the same data plotted on a common scale:

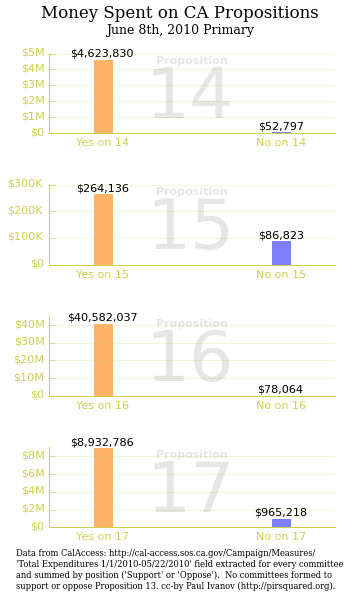
And the same two plots for money spent ((I don't fully understand what these numbers mean, as some groups' "Total Expenditures" exceed their "Total Contributions" and still had positive "Ending Cash")):
It could just be my perception of things, but I get pretty suspicious when there's a ton of money involved in politics, especially when it's this lopsided.
The only thing I have to add is you should Vote "YES" on Prop 15, because Larry Lessig says so, and so do the Alameda County Greens!
Update #1: Let me write it out in text, so that the search engines have an easier time finding this. According to the official record from Cal-Access (Secretary of State), as of May 22nd, 2010, there were $54.4 million spent in support of various propositions, most notably $40.5 million on Prop 16, $8.9 million on Prop 17, and $4.6 million on Prop 14. Compare that with a "grand" total of less than $1.2 million spent to oppose them, with a trivial $78 thousand (!!) to oppose Prop 16's $40.5 million deep pockets.
Update #2: The California Voter Foundation included more recent totals (they don't seem to be that different), as well as a listing of the top 5 donors for each side of a proposition in their Online Voter Guide.
Also, here's the python code used to generate these plots (enable javascript to get syntax highlighting):
# Create contributions and expenditures bar charts of committees supporting and
# opposing various propositions on the California Ballot for June 8th, 2010
# created by Paul Ivanov (http://pirsquared.org)

# figure(0) - Contributions by Proposition (as subplots)
# figure(1) - Expenditures by Proposition (as subplots)
# figure(2) - Contributions on a common scale
# figure(3) - Expenditures on a common scale

import numpy as np
from matplotlib import pyplot as plt
import locale

# This part was done by hand by collecting data from CalAccess:
# http://cal-access.sos.ca.gov/Campaign/Measures/
prop = np.array([
     4650694.66, 4623830.07    # Yes on 14 Contributions, Expenditures
    , 216050, 52796.71         # No  on 14 Contributions, Expenditures
    , 118807.45, 264136.30     # Yes on 15 Contributions, Expenditures
    , 200750.01, 86822.79      # No  on 15 Contributions, Expenditures
    , 40706258.17, 40582036.58 # Yes on 16 Contributions, Expenditures
    , 83187.29, 78063.91       # No  on 16 Contributions, Expenditures
    , 10328675.12, 8932786.06  # Yes on 17 Contributions, Expenditures
    , 1229783.79, 965218.48    # No  on 17 Contributions, Expenditures
    ])
prop.shape = -1,2,2

def currency(x, pos):
    """The two args are the value and tick position"""
    if x==0:
        return "$0"
    if x < 1e3:
        return '$%f' % (x)
    elif x< 1e6:
        return '$%1.0fK' % (x*1e-3)
    return '$%1.0fM' % (x*1e-6)

from matplotlib.ticker import FuncFormatter
formatter = FuncFormatter(currency)

yes,no = range(2)
c = [(1.,.5,0),'blue']  # color for yes/no stance
a = [.6,.5]             # alpha for yes/no stance
t = ['Yes','No ']       # text  for yes/no stance

raised,spent = range(2)
title = ["Raised for", "Spent on" ] # reuse code by injecting title specifics
field = ['Contributions', 'Expenditures']

footer ="""
Data from CalAccess: http://cal-access.sos.ca.gov/Campaign/Measures/
'Total %s 1/1/2010-05/22/2010' field extracted for every committee
and summed by position ('Support' or 'Oppose').  No committees formed to
support or oppose Proposition 13. cc-by Paul Ivanov (http://pirsquared.org).
""" # will inject field[col] in all plots

color = np.array((.9,.9,.34))*.9 # spine/ticklabel color
plt.rcParams['savefig.dpi'] = 100

def fixup_subplot(ax,color):
    """ Tufte-fy the axis labels - use different color than data"""
    spines = ax.spines.values()
    # liberate the data! hide right and top spines
    [s.set_visible(False) for s in spines[:2]]
    ax.yaxis.tick_left() # don't tick on the right

    # there's gotta be a better way to set all of these colors, but I don't
    # know that way, I only know the hard way
    [s.set_color(color) for s in spines]
    [s.set_color(color) for s in ax.yaxis.get_ticklines()]
    [s.set_visible(False) for s in ax.xaxis.get_ticklines()]
    [(s.set_color(color),s.set_size(8)) for s in ax.xaxis.get_ticklabels()]
    [(s.set_color(color),s.set_size(8)) for s in ax.yaxis.get_ticklabels()]
    ax.yaxis.grid(which='major',linestyle='-',color=color,alpha=.3)

# for subplot spacing, I fiddle around using the f.subplot_tool(), then get
# this dict by doing something like:
#    f = plt.gcf()
#    adjust_dict= f.subplotpars.__dict__.copy()
#    del(adjust_dict['validate'])
#    f.subplots_adjust(**adjust_dict)

adjust_dict = {'bottom': 0.12129189716889031, 'hspace': 0.646815834767644,
 'left': 0.13732508948909858, 'right': 0.92971038073543777,
 'top': 0.91082616179001742, 'wspace': 0.084337349397590383}

for col in [raised, spent]: #column to plot - money spent or money raised
    # subplots for each proposition (Fig 0 and Fig 1)
    f = plt.figure(col); f.clf(); f.dpi=100;
    for i in range(len(prop)):
        ax = plt.subplot(len(prop),1, i+1)
        ax.clear()
        p = i+14    #prop number
        for stance in [yes,no]:
            plt.bar(stance, prop[i,stance,col], color=c[stance], linewidth=0,
                    align='center', width=.1, alpha=a[stance])
            lbl = locale.currency(round(prop[i,stance,col]), symbol=True, grouping=True)
            lbl = lbl[:-3] # drop the cents, since we've rounded
            ax.text(stance, prop[i,stance,col], lbl , ha='center', size=8)

        ax.set_xlim(-.3,1.3)
        ax.xaxis.set_ticks([0,1])
        ax.xaxis.set_ticklabels(["Yes on %d"%p, "No on %d"%p])

        # put a big (but faded) "Proposition X" in the center of this subplot
        common=dict(alpha=.1, color='k', ha='center', va='center', transform = ax.transAxes)
        ax.text(0.5, .9,"Proposition", size=8, weight=600, **common)
        ax.text(0.5, .50,"%d"%p, size=50, weight=300, **common)

        ax.yaxis.set_major_formatter(formatter) # plugin our currency labeler
        ax.yaxis.get_major_locator()._nbins=5 # put fewer tickmarks/labels

        fixup_subplot(ax,color)

    adjust_dict.update(left=0.13732508948909858,right=0.92971038073543777)
    f.subplots_adjust( **adjust_dict)

    # Figure title, subtitle
    extra_args = dict(family='serif', ha='center', va='top', transform=f.transFigure)
    f.text(.5,.99,"Money %s CA Propositions"%title[col], size=12, **extra_args)
    f.text(.5,.96,"June 8th, 2010 Primary", size=9, **extra_args)

    #footer
    extra_args.update(va='bottom', size=6,ma='left')
    f.text(.5,0.0,footer%field[col], **extra_args)

    f.set_figheight(6.); f.set_figwidth(3.6); f.canvas.draw()
    f.savefig('CA-Props-June8th2010-%s-Subplots.png'%field[col])

    # all props on one figure (Fig 2 and Fig 3)
    f = plt.figure(col+2); f.clf()
    adjust_dict.update(left= 0.06,right=.96)
    f.subplots_adjust( **adjust_dict)
    f.set_figheight(6.)
    f.set_figwidth(7.6)

    extra_args = dict(family='serif', ha='center', va='top', transform=f.transFigure)
    f.text(.5,.99,"Money %s CA Propositions"%title[col], size=12, **extra_args)
    f.text(.5,.96,"June 8th, 2010 Primary", size=9, **extra_args)

    extra_args.update(ha='left', va='bottom', size=6,ma='left')
    f.text(adjust_dict['left'],0.0,footer%field[col], **extra_args)

    ax = plt.subplot(111)
    for stance in [yes,no]:
        abscissa=np.arange(0+stance*.30,4,1)
        lbl = locale.currency(round(prop[:,stance,col].sum()),True,True)
        lbl = lbl[:-3] # drop the cents, since we've rounded
        lbl = t[stance]+" Total"+ lbl.rjust(12)
        plt.bar(abscissa,prop[:,stance,col], width=.1, color=c[stance],
                alpha=a[stance],align='center',linewidth=0, label=lbl)
        for i in range(len(prop)):
            lbl = locale.currency(round(prop[i,stance,col]), symbol=True, grouping=True)
            lbl = lbl[:-3] # drop the cents, since we've rounded
            ax.text(abscissa[i], prop[i,stance,col], lbl , ha='center',
                    size=8,rotation=00)

    ax.set_xlim(xmin=-.3)
    ax.xaxis.set_ticks(np.arange(.15,4,1))
    ax.xaxis.set_ticklabels(["Proposition %d"%(i+14) for i in range(4)])
    fixup_subplot(ax,color)

    # plt.legend(prop=dict(family='monospace',size=9)) # this makes legend tied
    # to the subplot, tie it to the figure, instead
    handles, labels = ax.get_legend_handles_labels()
    l = plt.figlegend(handles, labels,loc='lower right',prop=dict(family='monospace',size=9))
    l.get_frame().set_visible(False)
    ax.yaxis.set_major_formatter(formatter) # plugin our currency labeler
    f.canvas.draw()
    f.savefig('CA-Props-June8th2010-%s.png'%field[col])

plt.show()